As per the “State of PostgreSQL 2021” survey by timescale for the best visualization tool, Grafana stood first with 38.7% responders.
In this post, we are going to configure Grafana to monitorPostgreSQL Database
There are 8 major steps involved in Installing and Configuring Grafana for PostgreSQL.
- Install Grafana(Monitoring server) # monitoring tool.
- Install prometheus(Monitoring server) # To store the metrics collected from servers.
- Install node_exporter(PostgreSQL Server) # To collect Linux metrics and send to prometheus.
- Integrate prometheus with node_exporter(Monitoring server)
- Install postgres_exporter(PostgreSQL Server) # To collect database metrics and send to prometheus.
- Integrate prometheus with postgres_exporter(Monitoring server)
- Configure dashboards for Linux and PostgreSQL metrics(Monitoring server)
- View the dashboard(Monitoring server)
In the below demonstration, we have used PostgreSQL 13 on CentOS 8 machine.
Table of Contents
STEP 0 – Install PostgreSQL 13 on CentOS 8
dnf install -y https://download.postgresql.org/pub/repos/yum/reporpms/EL-8-x86_64/pgdg-redhat-repo-latest.noarch.rpm

dnf -qy module disable postgresql

dnf install -y postgresql13-server

/usr/pgsql-13/bin/postgresql-13-setup initdb

systemctl enable postgresql-13

systemctl start postgresql-13

systemctl start postgresql-13
Login to the database cluster and ensure the host connectivity is enabled, do the following.
- Disable firewall
systemctl stop firewalld
systemctl disable firewalld
- listen_address=’*’ in postgresql.conf
- 0.0.0.0/0 in pg_hba.conf
STEP 1 – Install Grafana for PostgreSQL
1. Create a repository file
vi /etc/yum.repos.d/grafana.repo

[grafana]
name=grafana
baseurl=https://packages.grafana.com/oss/rpm
repo_gpgcheck=1
enabled=1
gpgcheck=1
gpgkey=https://packages.grafana.com/gpg.key
sslverify=1
sslcacert=/etc/pki/tls/certs/ca-bundle.crt
2. Install and start Grafana using yum:
yum install grafana -y

systemctl daemon-reload

systemctl enable grafana-server

systemctl start grafana-server

systemctl status grafana-server
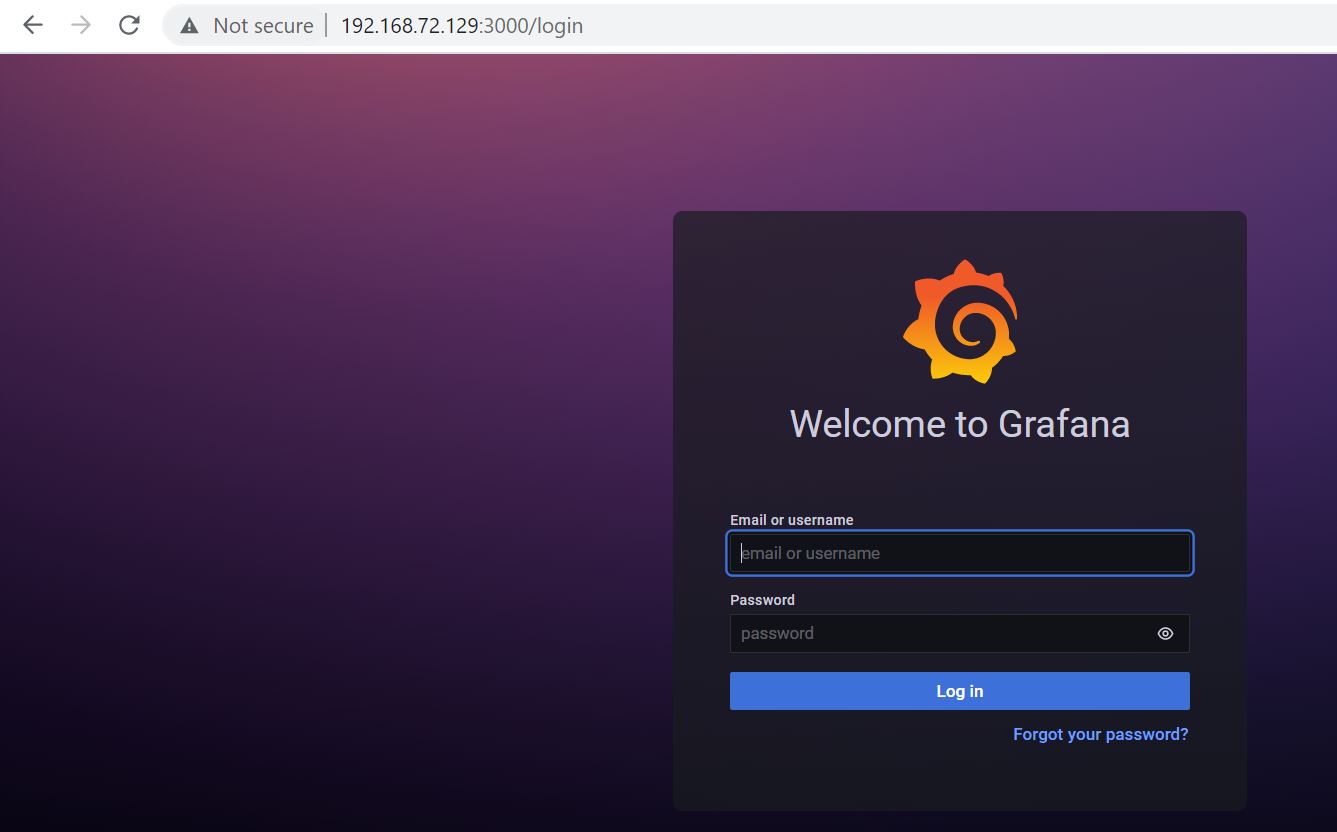
upon successful installation, verify with
http://192.168.72.129:3000/
Here the username and password is ‘admin’
STEP 2: Download and Install Prometheus as a data source
wget https://github.com/prometheus/prometheus/releases/download/v2.29.1/prometheus-2.29.1.linux-amd64.tar.gz

tar -xzf prometheus-2.29.1.linux-amd64.tar.gz

mkdir -p /root/prometheus-files

mv prometheus-2.29.1.linux-amd64 prometheus-files

cp /root/prometheus-files/prometheus /usr/bin/

cp /root/prometheus-files/promtool /usr/bin/
Verify successful installation with
prometheus –version
Next, we need to edit YAML file and start the prometheus service. We will do that in sometime.
STEP 3: Configuring Node Exporter on Postgres servers (to get Linux metrics like like CPU, Memory etc.,)
wget https://github.com/prometheus/node_exporter/releases/download/v1.2.2/node_exporter-1.2.2.linux-amd64.tar.gz

tar -xzf node_exporter-1.2.2.linux-amd64.tar.gz

cp node_exporter-1.2.2.linux-amd64/node_exporter /usr/bin/

node_exporter --version
Start node_exporter on the PostgreSQL server as a daemon:
node_exporter &
Validate the metrics being collected using curl:
curl http://localhost:9100/metrics
STEP 4 Add the metrics being collected using node_exporter to Prometheus
in the /root/prometheus-files/prometheus.yml add postgresql server IP details as below
static_configs:

- targets: ['localhost:9090']
- targets: ['192.168.72.129:9100']
Start Prometheus upon modifying the configuration file:
/usr/bin/prometheus --config.file /root/prometheus-files/prometheus.yml --storage.tsdb.path /root/prometheus-files/promdb --web.console.templates=/root/prometheus-files/consoles --web.console.libraries=/root/prometheus-files/console_libraries
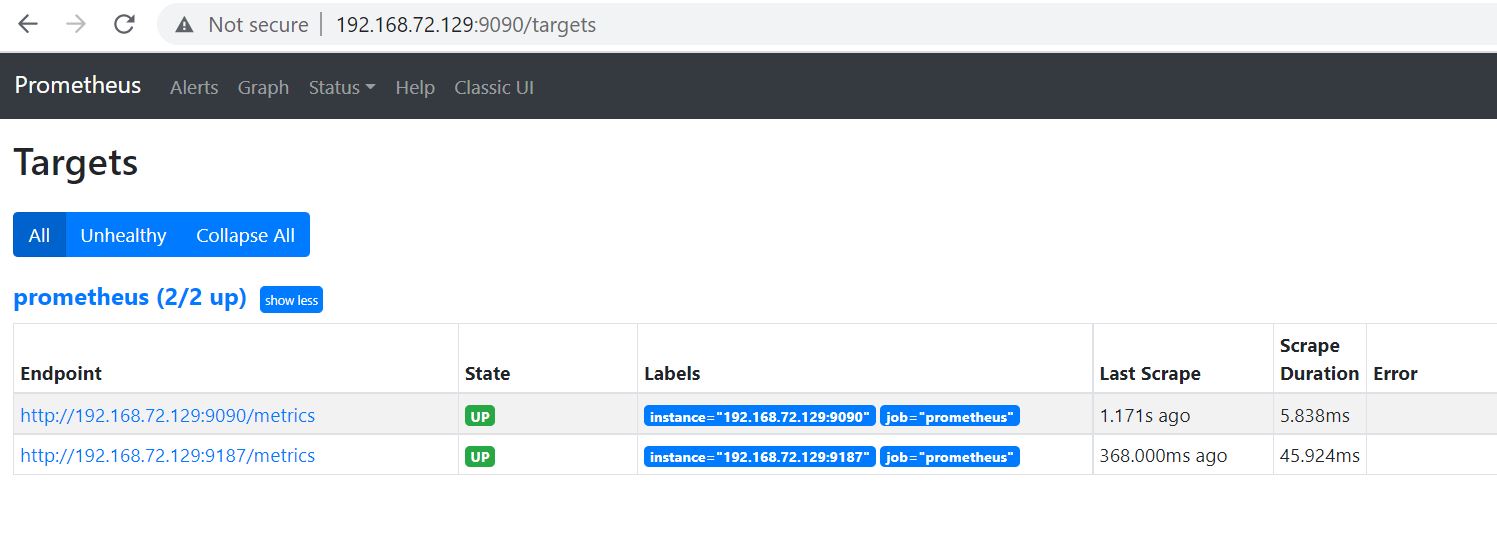
Go to the following URL and see whether the new target is visible:
http://192.168.72.129:9090/targets
STEP 5: Collecting PostgreSQL metrics using postgres_exporter on Postgres servers
yum install epel-release -y

yum install golang -y

wget https://github.com/prometheus-community/postgres_exporter/releases/download/v0.10.0/postgres_exporter-0.10.0.linux-amd64.tar.gz

tar -xzf postgres_exporter-0.10.0.linux-amd64.tar.gz

cp postgres_exporter-0.10.0.linux-amd64/postgres_exporter /usr/bin

postgres_exporter --version
Validate by connecting to the database using the connection URI used by the exporter.
psql -d “postgresql://postgres:postgres@192.168.72.129:5432/postgres?sslmode=disable”
Prepare the env File : You need to prepare an env file for the postgres exporter where we will set a variable known as DATA_SOURCE_NAME. Metrics from all defined databases in DATA_SOURCE_NAME will be collected.
example., export DATA_SOURCE_NAME=”postgresql://login:password@hostname:port/dbname”
export DATA_SOURCE_NAME="postgresql://postgres:postgres@192.168.72.129:5432/postgres?sslmode=disable"
Start the postgres_exporter
postgres_exporter &
STEP 6 Add the Postgres server and the port used by postgres_exporter to prometheus
in the /root/prometheus-files/prometheus.yml add postgresql server IP details as below
- targets: ['192.168.72.129:9187']
Final YAML should look like this
scrape_configs:
# The job name is added as a label `job=<job_name>` to any
timeseries scraped from this config.
- job_name: 'prometheus'
# metrics_path defaults to '/metrics'
# scheme defaults to 'http'.
static_configs:
- targets: ['192.168.72.129:9100']
- targets: ['192.168.72.129:9187']
Reload using SIGHUP or restart Prometheus:
Validate the targets using the following URL on the browser:
http://192.168.72.129:9090/targets
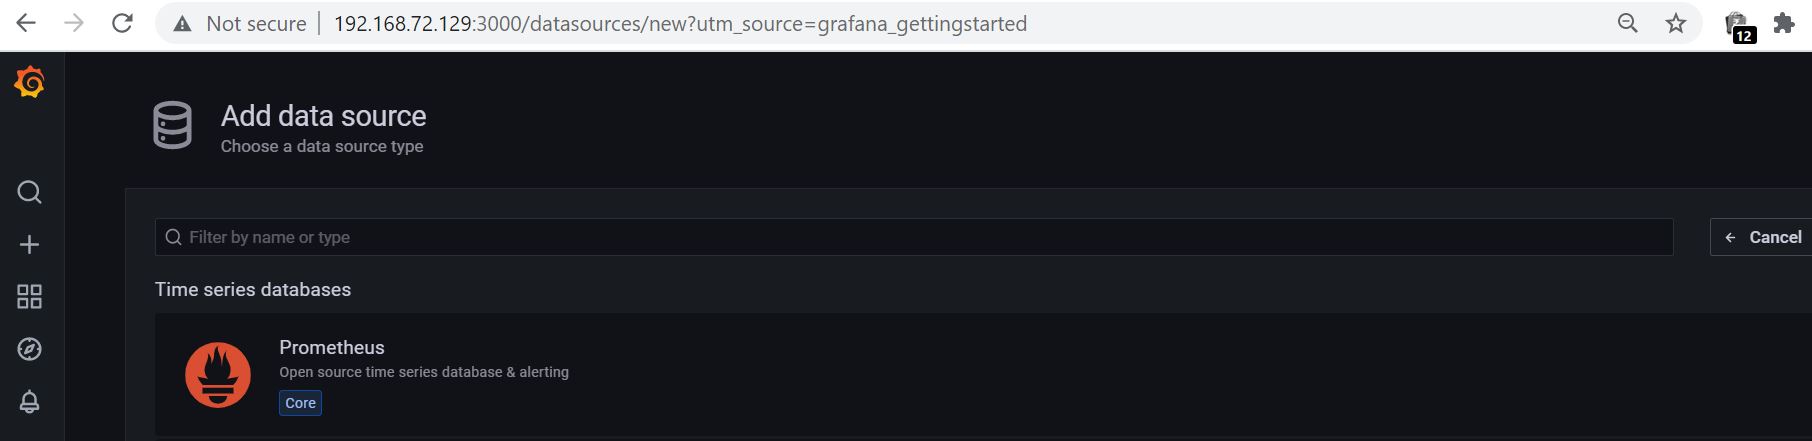
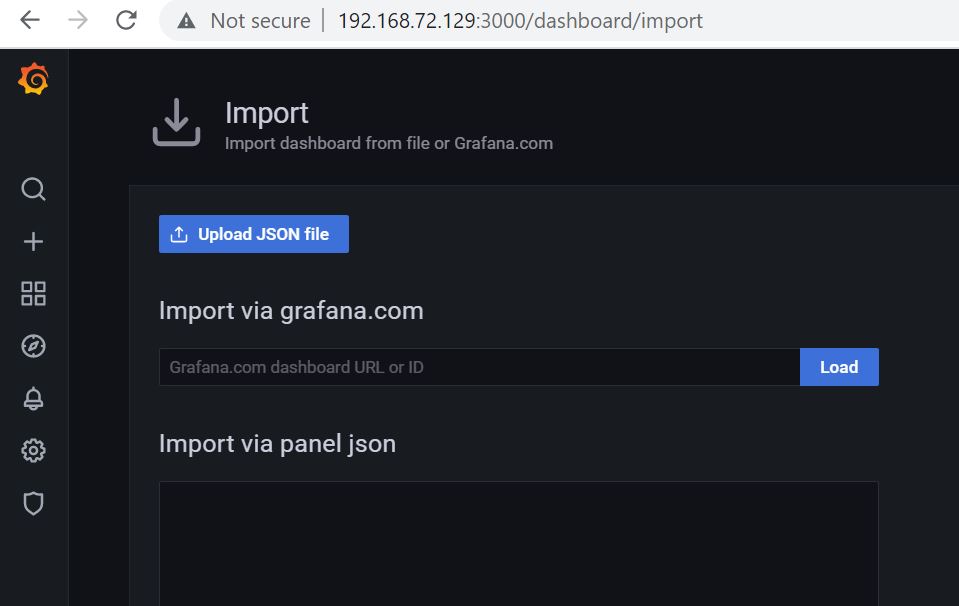
STEP 7: Importing dashboard
- Add datasource as prometheus
- Import linux metrics -> dashboard URL ID : 1860
- Import PostgreSQL Metrics -> dashboard URL ID : 9628
Upon successful configuration, you should see the dashboard with the values.
Bonus
Adding prometheus, node_exporter and postgres_exporter as services to operating system
Adding prometheus as a service
Create prometheus service file with below content
vi /etc/systemd/system/prometheus.service

[Unit]
Description=Prometheus
Wants=network-online.target
After=network-online.target

[Service]
User=root
Group=root
Type=simple
ExecStart=/usr/bin/prometheus \
--config.file /root/prometheus-files/prometheus.yml \
--storage.tsdb.path /root/prometheus-files/promdb \
--web.console.templates=/root/prometheus-files/consoles \
--web.console.libraries=/root/prometheus-files/console_libraries
[Install]
WantedBy=multi-user.target
Enable and start the service
sudo systemctl daemon-reload
sudo systemctl enable prometheus
sudo systemctl start prometheus
sudo systemctl status prometheus
Adding node_exporter as a service
Create node_exporter service file with below content
vi /etc/systemd/system/node_exporter.service

[Unit]
Description=Prometheus exporter for Postgresql
Wants=network-online.target
After=network-online.target
[Service]
User=postgres
Group=postgres
ExecStart=/usr/bin/node_exporter
Restart=always
[Install]
WantedBy=multi-user.target

Enable and start the service

sudo systemctl daemon-reload
sudo systemctl enable node_exporter
sudo systemctl start node_exporter
sudo systemctl status node_exporter
Adding postgres_exporter as a service
Create a datasource file
vi /opt/postgres_exporter/postgres_exporter.env
DATA_SOURCE_NAME="postgresql://postgres:postgres@192.168.72.129:5432/postgres?sslmode=disable"
Create postgres_exporter service file with below content
vi /etc/systemd/system/postgres_exporter.service

[Unit]
Description=Prometheus exporter for Postgresql
Wants=network-online.target
After=network-online.target
[Service]
User=postgres
Group=postgres
WorkingDirectory=/opt/postgres_exporter
EnvironmentFile=/opt/postgres_exporter/postgres_exporter.env
ExecStart=/usr/bin/postgres_exporter
Restart=always
[Install]
WantedBy=multi-user.target
Enable and start the service

sudo systemctl daemon-reload
sudo systemctl enable postgres_exporter
sudo systemctl start postgres_exporter
sudo systemctl status postgres_exporter
Reboot the machine and confirm everything is working.